


[!NOTE]
This is one of 198 standalone projects, maintained as part
of the @thi.ng/umbrella monorepo
and anti-framework.
🚀 Please help me to work full-time on these projects by sponsoring me on
GitHub. Thank you! ❤️
About
Configurable k-means & k-medians (with k-means++ initialization) for n-D vectors.
Status
BETA - possibly breaking changes forthcoming
Search or submit any issues for this package
Installation
yarn add @thi.ng/k-means
ESM import:
import * as kmeans from "@thi.ng/k-means";
Browser ESM import:
<script type="module" src="https://esm.run/@thi.ng/k-means"></script>
JSDelivr documentation
For Node.js REPL:
const kmeans = await import("@thi.ng/k-means");
Package sizes (brotli'd, pre-treeshake): ESM: 870 bytes
Dependencies
Note: @thi.ng/api is in most cases a type-only import (not used at runtime)
Usage examples
Two projects in this repo's
/examples
directory are using this package:
| Screenshot | Description | Live demo | Source |
|---|
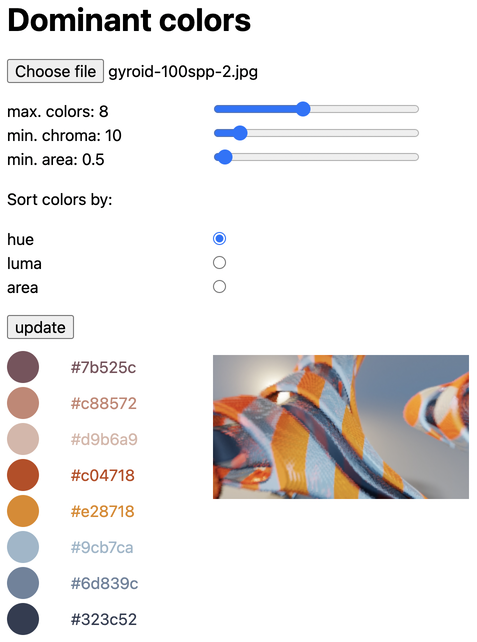 | Color palette generation via dominant color extraction from uploaded images | Demo | Source |
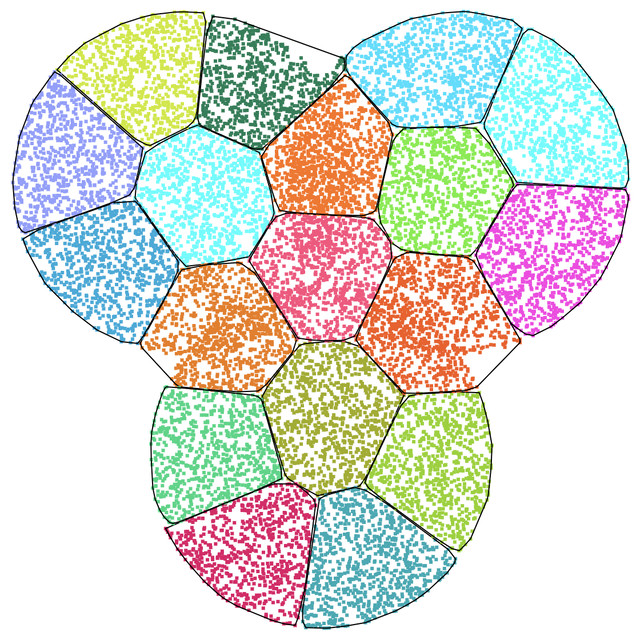 | k-means clustering visualization | Demo | Source |
API
Generated API docs
Example usage: Clustering cities by lat/lon location
import { HAVERSINE_LATLON } from "@thi.ng/distance";
import { kmeans, meansLatLon } from "@thi.ng/k-means";
const cities = [
{ id: "anchorage", latlon: [61.21806, -149.90028] },
{ id: "berlin", latlon: [52.52437, 13.41053] },
{ id: "boston", latlon: [42.35843, -71.05977] },
{ id: "calgary", latlon: [51.05011, -114.08529] },
{ id: "cape town", latlon: [-33.92584, 18.42322] },
{ id: "detroit", latlon: [42.33143, -83.04575] },
{ id: "harare", latlon: [-17.82772, 31.05337] },
{ id: "london", latlon: [51.50853, -0.12574] },
{ id: "manila", latlon: [14.6042, 120.9822] },
{ id: "nairobi", latlon: [-1.28333, 36.81667] },
{ id: "new york", latlon: [40.71427, -74.00597] },
{ id: "paris", latlon: [48.85341, 2.3488] },
{ id: "philadelphia", latlon: [39.95233, -75.16379] },
{ id: "portland", latlon: [45.52345, -122.67621] },
{ id: "seoul", latlon: [37.566, 126.9784] },
{ id: "shanghai", latlon: [31.22222, 121.45806] },
{ id: "tokyo", latlon: [35.6895, 139.69171] },
{ id: "vancouver", latlon: [49.24966, -123.11934] },
{ id: "vienna", latlon: [48.20849, 16.37208] },
{ id: "windhoek", latlon: [-22.55941, 17.08323] },
];
const clusters = kmeans(
5,
cities.map((x) => x.latlon),
{
strategy: meansLatLon,
dist: HAVERSINE_LATLON,
}
);
for (let c of clusters) {
console.log(c.items.map((i) => cities[i].id));
}
Authors
If this project contributes to an academic publication, please cite it as:
@misc{thing-k-means,
  title = "@thi.ng/k-means",
  author = "Karsten Schmidt",
  note = "https://thi.ng/k-means",
  year = 2021
}
License
© 2021 - 2024 Karsten Schmidt // Apache License 2.0


